


Executive Summary
Loss of exclusivity (LOE) is becoming one of the most consequential events in the life cycle of pharmaceutical and MedTech assets. As high-revenue products move off patent and contract-based purchasing expands, commercial performance in a two to three year LOE window can determine whether an asset becomes a high-volume, margin-diluted “commodity” or a strategically managed cash generator. Recent analyzes indicate that originator prices typically decline by 30–80% across high-income countries in the years following patent expiry, with some markets experiencing even steeper erosion. In publicly-funded systems where contracts dominate access, competitive pressure and payer monopsony power amplify this effect.
At the same time, the industry is facing a pronounced “patent cliff”: by 2027–2028, tens of billions in annual revenue are scheduled to lose exclusivity as flagship biologics and small molecules face generic and biosimilar competition. Many organizations still approach LOE contract pricing reactively, relying on partial market intelligence, historical discount “rules of thumb” and individual account experience. This leaves significant value at risk: margins are sacrificed unnecessarily in some markets while volumes are ceded too early in others.
The central thesis of this report is that LOE contract pricing can be transformed into a repeatable, data-driven capability built on three pillars:
Systematic analysis of historical contract awards and post-LOE price trajectories.
Using award data, public procurement portals and internal contract archives, organizations can quantify price evolution, competitor entry patterns, regional aggression levels and the relationship between price, volume commitments and award shares.
Structured pricing corridors and volume–margin trade-offs.
Instead of anchoring on a single “target discount”, leading teams define corridors between floor and ceiling prices for each asset, segment and contract type. Floors reflect fully loaded cost and minimum acceptable margin; ceilings reflect competitive reference points implied by contract awards and generic benchmarks. Within the corridor, bid choices are driven by explicit volume, share and strategic positioning objectives.
Embedded guidance and operating models for front-line teams.
Intelligence only creates value when it is translated into simple, actionable guidance at the moment of pricing. AI-enabled contract platforms and pricing engines can convert award analytics, contract terms and LOE strategy into recommended price ranges, guardrails and scenario simulations for each opportunity, while enforcing governance and documenting rationale for decisions.
Throughout the report, we describe:
- How LOE dynamics reshape price, volume and margin, and why contract environments behave differently to retail channels.
- A practical decision framework for LOE contract pricing that connects asset strategy, market archetypes and opportunity-level bid choices.
- Methods for extracting competitive intelligence from award data, including how to infer competitor aggression patterns, regional strategies and willingness to trade price for share.
- Ways to translate these insights into concrete pricing corridors, bid guidance rules and governance mechanisms that front-line teams can apply consistently.
- An implementation roadmap that starts with a focused LOE pilot portfolio and scales to a cross-asset “intelligent guidance” capability.
The intended outcome is a step change in how organizations manage value at LOE: from fragmented, locally-driven discounting to an orchestrated, insight-led approach that defends critical volumes where it matters, protects margin where it is possible and preserves strategic option value across the asset life cycle.
Table 1. Selected Late-2020s Pharma Patent Cliff Exposures (Illustrative)
By 2027–2028, a concentrated cluster of LOE events will expose well over $180 billion of branded revenue annually, with just a handful of assets already accounting for around $60 billion of that exposure.
| Company / Group | Key product(s) facing LOE (2027–2028) | ~2024 global sales (US$ bn) | Main LOE / patent expiry window | Illustrative revenue at risk lens |
| Merck | Keytruda (pembrolizumab) | ~29.5 | 2028 (US / major markets) | Anchor oncology franchise, single-asset exposure close to half of company revenue. |
| BMS / Pfizer | Eliquis (apixaban) | >10 | 2026–2028 (EU then US) | Leading anticoagulant; generic entry expected to erode double-digit billion revenue. |
| Bristol Myers Squibb | Opdivo (nivolumab) | ~9.3 | 2028 (US) | Major immuno-oncology pillar following Keytruda. |
| Merck | Gardasil / Gardasil 9 (HPV vaccine) | ~8.6 | 2028 (US) | Second-largest product for Merck; LOE coincides with Keytruda cliff. |
| Selected cluster total | ≈60+ | 2027–2028 | Just these four assets alone represent c. $60bn in annual revenue approaching the 2027–2028 cliff. | |
| Industry-wide view | Multiple blockbusters across top 20 pharma | ≈180 (annual) | 2027–2028 | Estimated annual drug revenues losing patent protection by 2027–2028 across Big Pharma. |
Table 2. MedTech “Quasi-LOE” Exposure Across Mature Device Segments
In MedTech the pattern is less a single patent cliff on a hero molecule and more a rolling ‘contract cliff’ as high-value device categories mature, competitors proliferate and hospitals or payers increasingly treat products as substitutable in large framework contracts.
| Segment / category | Example franchises / players | Approx. 2024 market scale (US$ bn) | LOE-style dynamic by late 2020s |
| Orthopedic implants (hip, knee, trauma) | Zimmer Biomet, Stryker, DePuy Synthes, Smith&Nephew | Orthopedic implants c. $47–49bn in 2024, within a ~$56bn global orthopedics market. | Highly exposed to hospital and regional contracts; growing competitive density and slower growth have already led to portfolio restructuring (e.g. J&J spinning off DePuy Synthes after ~$9.2bn revenue in 2024). |
| Drug-eluting stents (DES) | Abbott, Boston Scientific, Medtronic, others | DES market around $7.8–8.5bn in 2023–24, projected to reach $11–15bn by 2030–34. | Category is mature, with multiple clinically comparable options; procurement increasingly treats platforms as substitutable, driving contract-based discounting and “step-down” pricing over cycles rather than a single patent cliff. |
| Structural heart / TAVR | Edwards Lifesciences, Medtronic, emerging entrants | TAVR market about $6.2–6.8bn in 2024, forecast near $10–14bn by 2029–33. | Today still a premium, innovation-led space, but rapid growth and more competitors mean payers will increasingly contract valves and treat them as a comparable category, introducing LOE-like price pressure as evidence “matures”. |
| Knee implants (sub-segment of ortho) | Zimmer Biomet, Stryker, DePuy Synthes | Knee implants alone ~$8.1bn in 2024, growing slowly to 2030. | High volumes and strong brand recognition, but little differentiation perceived at contract; hospitals and GPOs negotiate aggressive discounts on frameworks, effectively “commoditizing” the category over time. |
| EU hospital device contracts (cross-category) | Imaging, cardiology, OR, monitoring, etc. | EU public device contracts affected by new trade rules cover contracts worth >€60bn/year. | Even without patent expiry, devices entering these contracts face LOE-like conditions: large, infrequent awards, high supplier substitutability, and structural pressure to trade price for access at scale. |
The LOE Pricing Challenge
LOE in commercial context
Loss of exclusivity marks the transition from protected, often premium-priced originator status into a landscape where generic or biosimilar competitors can enter with substantially lower costs and aggressive launch discounts. Multiple empirical studies have documented the price impact:
- In high-income markets, the median drug price typically falls around 40% within four years of patent expiry.
- Another multi-country analysis reports post-LOE price reductions of 30–80% over several years, depending on competitive intensity and policy frameworks.
- In some contract-driven systems, price reductions of up to 80% for generics relative to originators have been projected, particularly in off-patent segments with robust competition.
This erosion is not uniform. It varies by:
- Product type (small molecule vs biologic, chronic vs acute therapy).
- Market structure (number of competitors, contract vs free-pricing environments).
- Policy instruments (reference pricing, volume-price contracts, mandatory contracts, substitution rules).
For originator companies, LOE is therefore a portfolio-level event rather than a single binary switch. Across markets, pricing teams must decide where to prioritize revenue retention, where to protect margin and where to allow controlled erosion.
Contract-driven LOE dynamics
Contracting amplifies LOE effects. In publicly funded systems, multi-year contracts for hospitals, regional purchasing bodies or national agencies often determine the bulk of volume for off-patent molecules. Key characteristics include:
- Winner-takes-most structures. Single-winner contracts or heavily skewed multi-winner designs mean that small price differences can drive large volume shifts.
- Centralized volume commitments. Volume-price contracts combine guaranteed demand with price reductions, shifting risk toward the manufacturer.
- Formal award criteria. Non-price factors (supply security, service levels, outcomes guarantees, ESG metrics) are increasingly present, but price remains the dominant discriminant.
In this context, LOE pricing decisions have three compounding effects:
- Immediate impact on revenue and margin. Price cuts at contract may be steep but are often necessary to retain anchor positions.
- Signal effect for subsequent contracts and negotiations. Early LOE contract outcomes create reference points that competitors, payers and other regions use as benchmarks.
- Strategic positioning for the remaining life cycle. Losing key contracts early can precipitate rapid share loss, while disciplined participation in targeted contracts can preserve a profitable niche.
Why LOE contract pricing requires a distinct approach
Pre-LOE pricing is dominated by value-based arguments, differential access strategies and indication-specific evidence. Mature generic environments are often governed by commoditized discount ladders. LOE contract windows sit between these two states and require:
- Explicit scenario planning. Different competitors bring different cost bases and strategic imperatives; LOE contracts must accommodate scenarios ranging from single generic entrants to crowded bidding landscapes.
- High-quality competitive intelligence. Traditional market research is slow and high level; contract award data offers more granular and timely signals.
- Integrated view of price, volume and terms. Unit price alone is a poor proxy for value. Volume guarantees, exclusivity, supply commitments and risk-sharing mechanics meaningfully alter the economics.
Without a tailored LOE approach, organizations typically fall into one of two failure modes:
- Over-defence: aggressive uniform discounting across markets to “hold share at all costs”, destroying margin even in markets where competition is slow to materialize.
- Passive erosion: maintaining pre-LOE price logic in contract environments, leading to rapid loss of anchor awards and irreversible share declines.
Framework for LOE Contract Pricing Strategy
This section proposes a practical framework that links asset strategy to opportunity-level bid decisions. It can be implemented manually or embedded within AI-enabled contract pricing solutions.
Step 1 – Define the LOE role of the asset
For each asset, leadership should articulate a clear LOE intent by market cluster:
Volume-maximizing cash generator
- Objective: maintain high volume at reduced margin to maximize cumulative cash flow.
- Typical context: high-volume chronic therapies with strong brand recognition, favourable cost of goods and robust manufacturing capacity.
Margin-protected niche
- Objective: protect price and focus on segments that value brand, continuity of supply or differentiated services.
- Typical context: complex biologics, specialized delivery forms, or markets with lower generic penetration.
Orderly exit or selective participation
- Objective: avoid value-destructive contracts and retain presence only where economics or strategic relationships justify it.
This strategic intent informs the acceptable position within pricing corridors and the willingness to trade price for share.
Step 2 – Build LOE pricing corridors
Pricing corridors set realistic bounds for bids based on economics and competition. They should be constructed for each asset, major segment and contract archetype (e.g. national, regional, hospital).
Ingredients for corridors:
- Economic floor
- Fully loaded cost: manufacturing, logistics, lifecycle rebates, service obligations.
- Target minimum margin: often portfolio-determined (e.g. minimum contribution margin thresholds).
- Competitive ceiling
- Historical award prices pre- and post-LOE in the same or analogous markets.
- Generic and biosimilar price benchmarks relative to originator (e.g. generics at 20–30% of originator price, biosimilars at roughly half, depending on market).
- Market and policy filters
- Presence of reference pricing or mandatory discounts.
- Volume-price or risk-sharing policies that might justify more aggressive pricing in exchange for volume security.
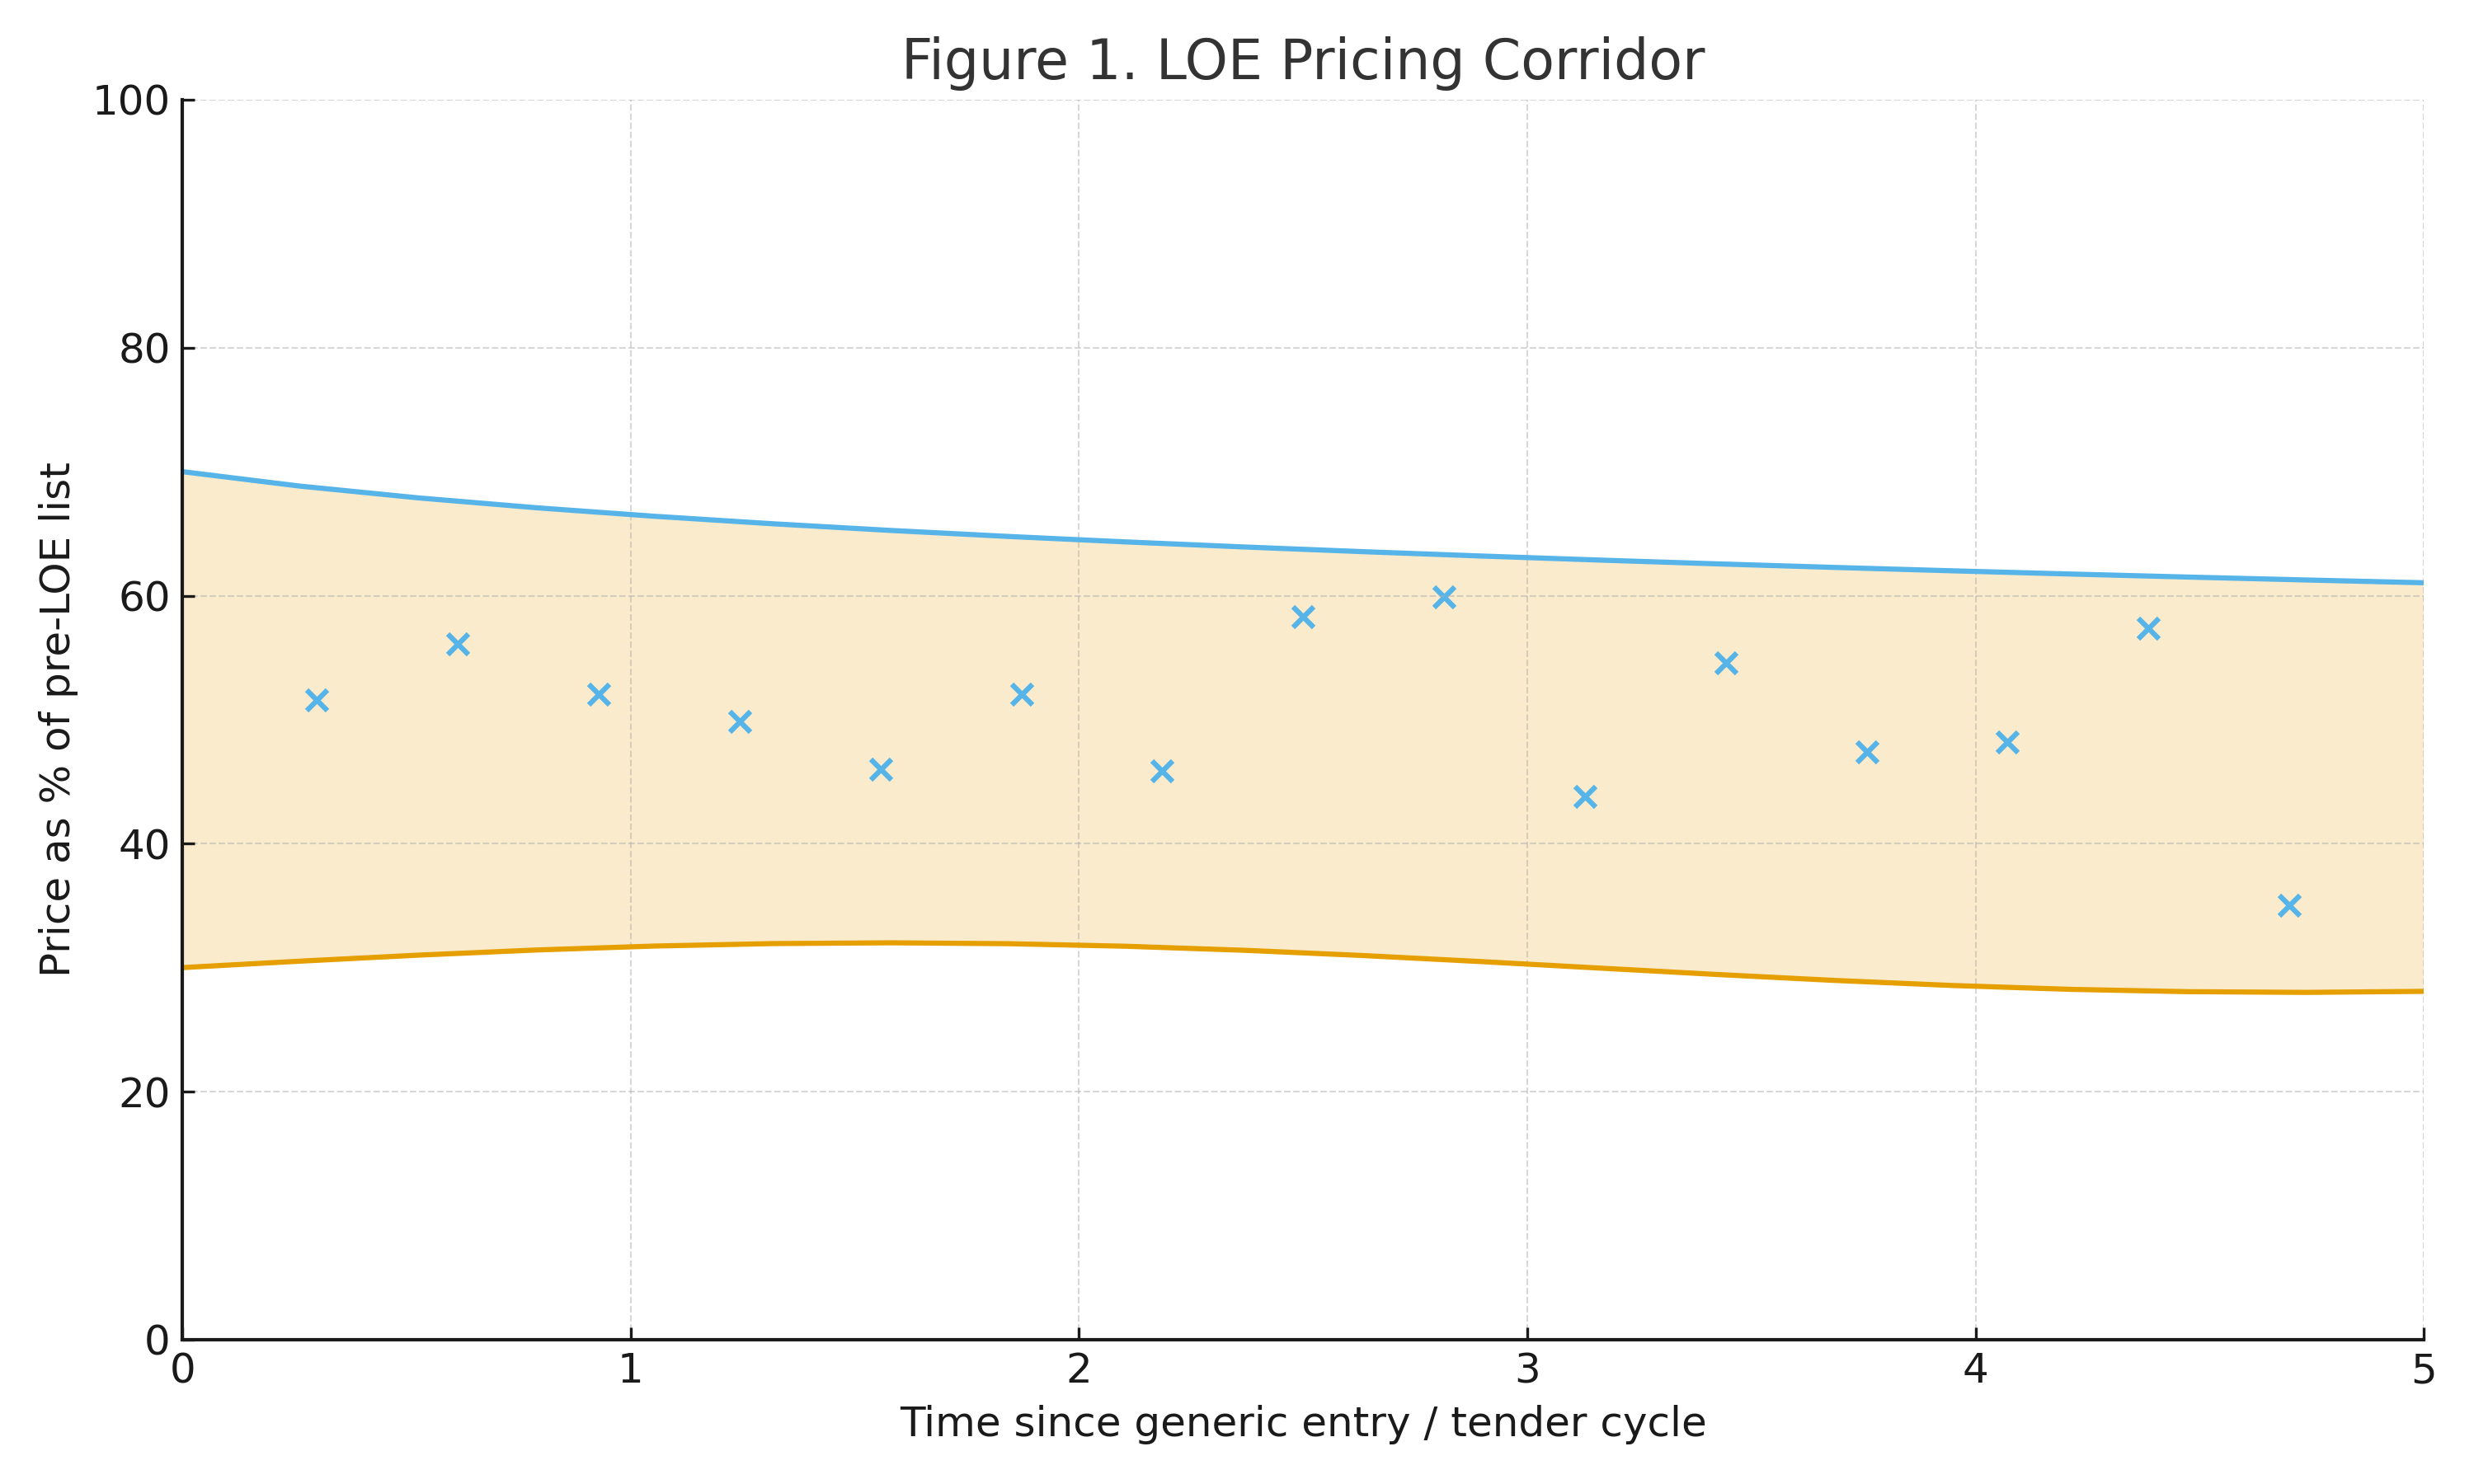
Figure 1. LOE Pricing Corridor (Illustrative)
Price (as % of pre-LOE list) over time since generic entry, with the shaded band representing the economic floor and competitive ceiling, and dots indicating historical contract awards.
Step 3 – Volume–margin trade-off analysis
Corridors provide bounds, but bid selection requires explicit trade-offs between price, share and margin. A simple yet powerful approach is to create scenario tables per contract:
- Scenario A – Defend anchor share
- Price closer to corridor floor.
- Assumes high share retention (e.g. >70%).
- Lower unit margin, high contribution via volume.
- Scenario B – Balanced approach
- Mid-corridor price.
- Moderate share (e.g. 30–50%), aiming to remain a “must-carry” option without being price leader.
- Scenario C – Premium niche
- Price closer to corridor ceiling.
- Lower share (e.g. ≤20%), focusing on segments valuing continuity, brand or differentiated service.
For each scenario, teams should calculate:
- Expected net revenue and contribution margin.
- Impact on manufacturing capacity utilization and supply risk.
- Signal implications for adjacent markets and future contracts (e.g. whether a deep discount will be used as reference elsewhere).
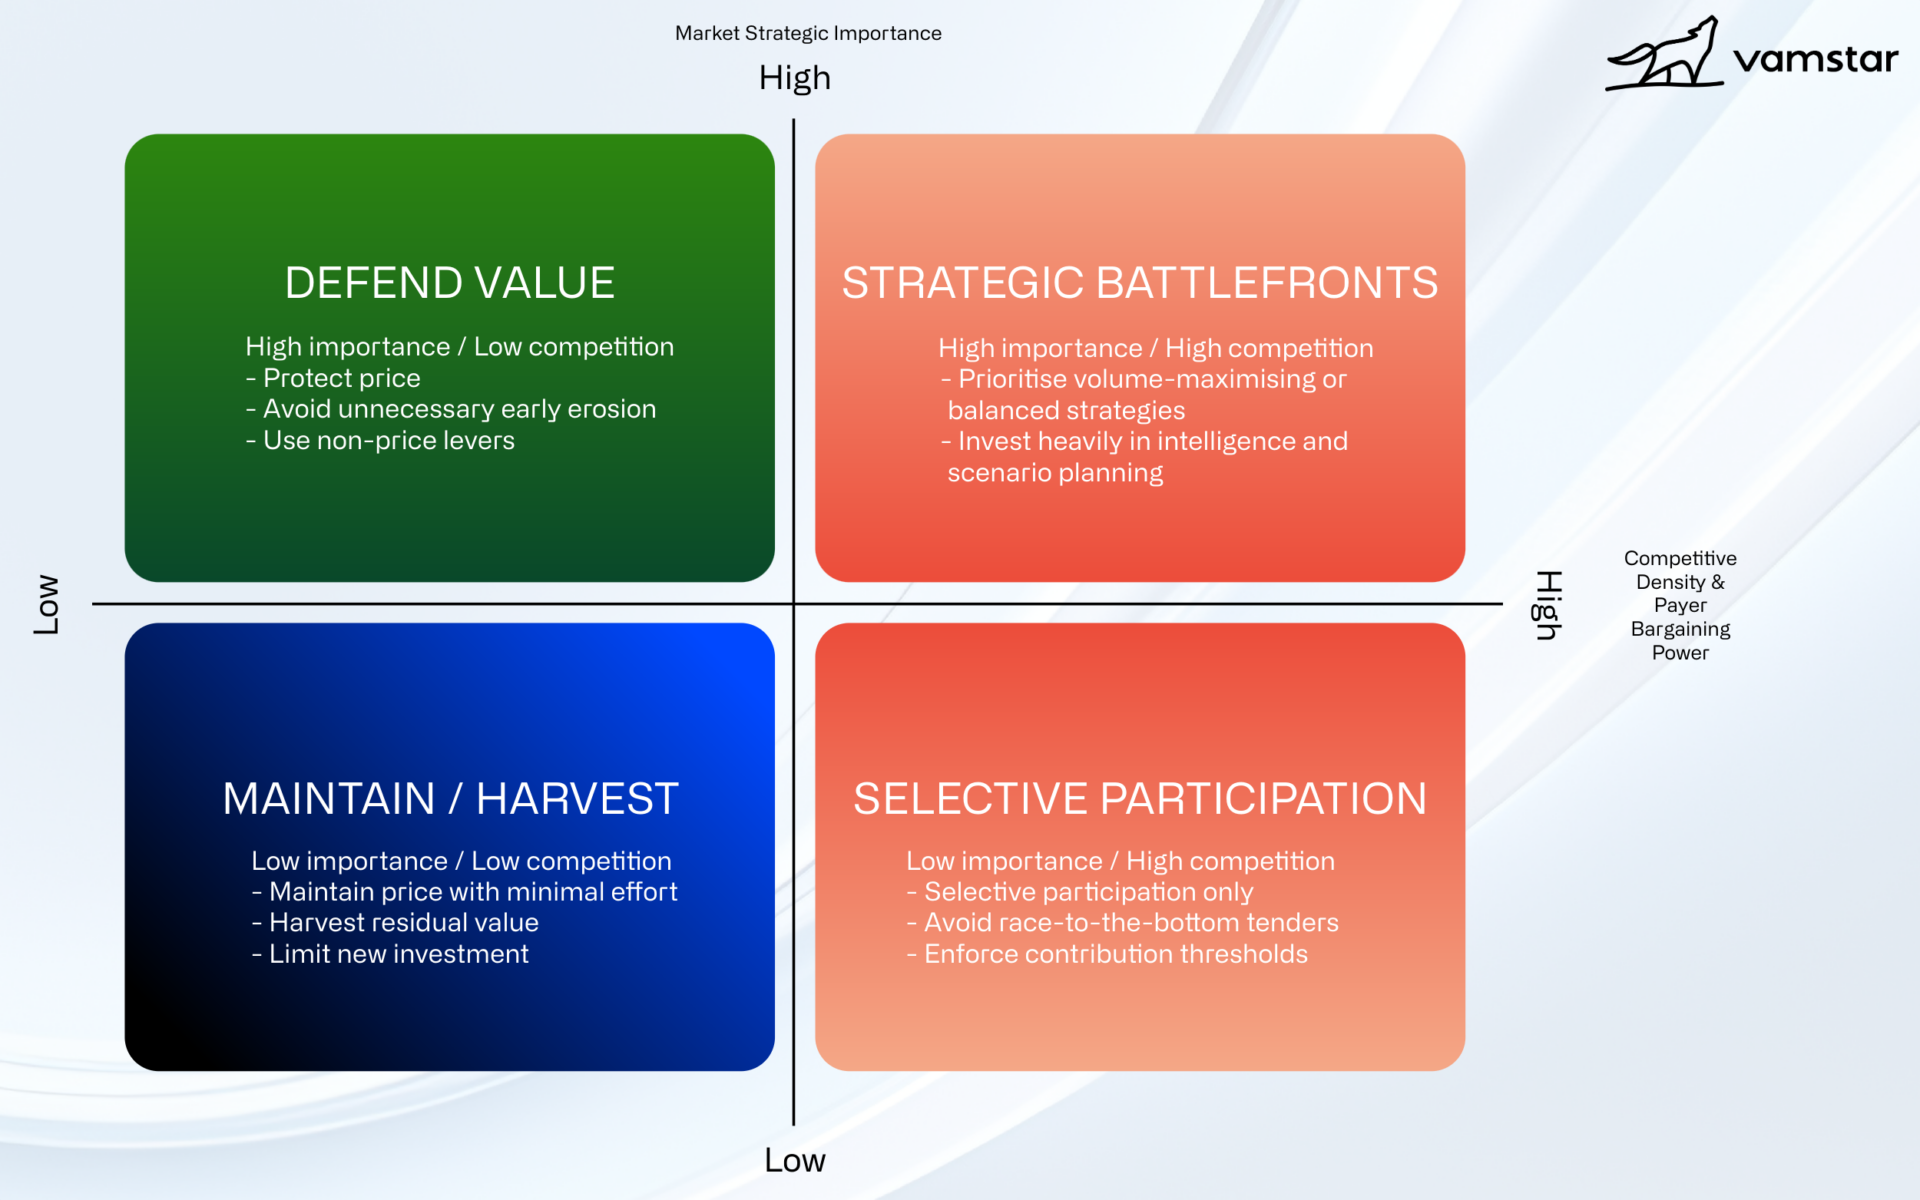
Step 4 – Strategic positioning matrix
To align decisions across markets, organizations can use a simple matrix:
- Y-axis: market strategic importance (high to low).
- X-axis: competitive density and payer bargaining power (low to high).
Each asset–market pair is mapped into this matrix, yielding archetypes such as:
- High importance / low competition: protect price, avoid unnecessary early erosion.
- High importance / high competition: prioritize volume-maximizing or balanced strategies; invest heavily in intelligence and scenario planning.
- Low importance / high competition: selective participation; avoid race-to-the-bottom contracts that fail contribution thresholds.
This matrix becomes the “front page” of LOE contract strategy, guiding corridor calibration and scenario preferences.
Competitive Intelligence from Contract Awards
Contract award data is one of the richest yet under-exploited sources of competitive intelligence for LOE pricing. Public procurement portals, contract platforms and internal archives contain detailed records of who won, at what price and under what terms.
Data sources and integration
Key inputs include:
- Public award databases (national and regional portals, TED, national procurement platforms).
- Internal contracting systems with historical contracts, submitted bids and awarded prices.
- Market intelligence providers and AI platforms that aggregate contract notices, awards, volumes and competitor participation.
The first step is to standardize and integrate this data into a consolidated contract awards dataset: products mapped to ATC or device categories, prices normalized per unit or defined daily dose, and contract types classified consistently.
Extracting competitor behavior patterns
Once integrated, several analytical lenses can reveal behavior that is critical for LOE decisions:
1. Pricing trajectories by competitor and region
- Chart competitor prices as a percentage of originator list over time and across regions.
- Identify “lead aggressors” vs “followers” and markets where entrants are unusually cautious.
2. Entry timing and bid aggressiveness at LOE
- For key molecules, map when each generic or biosimilar first appears in contract awards and at which discount level relative to originator and existing generics.
- Distinguish between challengers using deep initial discounts vs “step-down” strategies over multiple cycles.
3. Share-of-award and supplier concentration
- Calculate share of awarded volume or value by supplier across contracts, identifying markets trending toward single-supplier dominance vs diversified multi-winner structures.
4. Sensitivity of award outcomes to non-price criteria
- Compare price differences among winners and losers in contracts where technical or quality scores are published.
- Identify segments where non-price attributes (supply history, quality, service) allow incumbents to maintain price premia.
These analyzes can be operationalized into competitor “playbooks”: for example, Generic A is consistently the most aggressive early entrant in Central Europe but moderate in Nordics; Originator B typically trades price for volume only where national volume-price schemes are available.
Advanced analytics and AI
Machine learning approaches can increase predictive power by modeling the relationship between unit prices and multiple predictors: contract type, number of bidders, market, contract length, and policy environment.
Use cases include:
- Price prediction models that estimate likely winning price ranges for upcoming contracts.
- Win-probability models that simulate the chance of success at different price points within the corridor.
- Signal detection that flags when competitor behavior deviates significantly from historical patterns, suggesting strategic shifts.
Such models are particularly valuable near LOE, when uncertainty is highest and competitors are adjusting playbooks in real time.
Translating Intelligence into Pricing Corridors and Bid Guidance
Collecting and analyzing data is not sufficient; the ultimate goal is to deliver simple, trusted guidance to the teams responsible for setting contract prices.
From analytics to operational guidance
A practical structure for operationalizing guidance is:
- Market-specific LOE playcards
- Summarize for each market: LOE role of the asset, pricing corridor, competitor archetypes, key policy constraints and volumes at stake.
- Bid recommendation engines
- For each live contract, combine corridor, competitor patterns, contract type and strategic objectives to propose a recommended price, plus upper and lower bounds.
- Decision logging and learning loops
- Capture chosen price, rationale and outcome; feed this back into the models and playcards to refine guidance.
Example: turning award data into guidance
Consider an LOE molecule with the following insights from award analytics:
- In Region A, three generics have entered, and contract prices have converged to 25–30% of pre-LOE originator price within two contract cycles.
- In Region B, only one biosimilar is present; prices remain around 60–65% of originator levels and contracts are multi-winner.
For a national contract in Region A, the guidance might specify:
- Corridor: 20–35% of pre-LOE price.
- Strategic recommendation: adopt a volume-maximizing strategy, with bids in the 22–25% range to retain anchor share.
- Mandatory governance: business case required to bid above 30%, given historical auction dynamics.
For Region B:
- Corridor: 45–70%.
- Strategic recommendation: maintain a balanced or premium niche position in the 55–65% range, emphasizing non-price attributes.
- Conditions for more aggressive pricing: only if contract design shifts toward winner-takes-most or volume guarantees increase substantially.
Guardrails and governance
To avoid value-destructive decisions, organizations should institute:
- Global and regional guardrails on minimum acceptable margins and maximum discounts at LOE.
- Escalation thresholds for bids outside recommended corridors or involving large single-buyer volume concentrations.
- Governance committees that review high-impact LOE contracts, particularly in early cycles where reference points are being set.
Local Market and Contract Term Adaptation
Even with global frameworks, LOE contract pricing must be tailored to local realities.
Market archetypes
Common market archetypes include:
- Highly centralized, contract-driven systems
- National or regional monopoly buyers, frequent single-winner contracts, strong price pressure but also large, predictable volumes.
- Hybrid systems with mixed contract and reimbursement mechanisms
- Hospital contracts coexist with retail reimbursement; price signals from one channel influence the other.
- Fragmented, hospital-level contracting
- Multiple hospital networks or insurers run independent contracts; competitive dynamics and price elasticity vary widely.
The LOE framework should specify differentiated discount bands, volume expectations and participation criteria for each archetype.
Role of contract terms
Contract design can materially change the economics of apparent “headline prices”:
- Volume-price contracts: deeper discounts in exchange for guaranteed or minimum volumes can be attractive if manufacturing capacity and supply reliability are strong.
- Multi-winner contracts: lower price elasticity may permit higher prices if non-price criteria and supply continuity matter more.
- Outcome- or performance-linked contracts: particularly relevant for biologics and complex therapies, where payers may accept higher prices in exchange for risk sharing.
Contract pricing guidance should therefore always be expressed as a function of both unit price and term structure (volume, duration, exclusivity, penalties).
Operating Model and Technology Enablers
Cross-functional LOE squads
Effective LOE contract pricing requires coordinated input from:
- Global and regional pricing and market access.
- Contracting teams.
- Finance and business planning.
- Supply chain and manufacturing.
Establishing cross-functional LOE “squads” for priority assets ensures that strategic intent, corridor design, competitive intelligence and front-line guidance are aligned.
Data and tooling
Key enablers include:
- A centralized contract data lake, aggregating public awards, internal bid histories and contract terms.
- Analytics and AI platforms capable of handling large volumes of procurement data, predicting prices and win probabilities, and surfacing competitor behavior shifts.
- Workflow-integrated guidance tools, such as AI-driven contract pricing assistants, that plug directly into bid preparation processes and CRM systems, ensuring guidance is available at the point of decision.
Specialized platforms, including those focused on contract intelligence and pricing decision support (such as Vamstar’s AI-driven solutions for contracts and pricing), demonstrate how these capabilities can be combined to deliver near real-time guidance using award data, price histories and contract structures as inputs.
Implementation Roadmap
A pragmatic approach to building LOE contract pricing capabilities can follow four stages:
Stage 1 – Diagnostic and prioritization
- Identify the LOE portfolio for the next 3–5 years, with revenue at risk by region.
- Map markets into archetypes and assign provisional LOE roles (cash generator, niche, selective).
- Conduct a rapid awards and price trajectory analysis for 2–3 flagship molecules to establish current state.
Stage 2 – Corridor design and pilot
- Build pricing corridors for selected asset–market combinations, using available award and contract data.
- Develop playcards and simple scenario tools for front-line teams in a subset of priority markets.
- Run a pilot across one LOE cycle or key contract season; capture decisions, rationale and outcomes.
Stage 3 – Scale and embed intelligent guidance
- Expand corridor methodology to broader LOE portfolio and additional markets.
- Integrate award analytics into standard contract pricing workflows through AI-enabled tools and dashboards.
- Formalize governance structures, guardrails and performance metrics (e.g. retained LOE revenue, margin vs plan, variance between guided and actual bids).
Stage 4 – Continuous improvement and learning
- Regularly update models and corridors as new awards, competitors and policies emerge.
- Use post-contract reviews to refine assumptions on price elasticity, competitor strategies and volume responses.
- Link LOE learnings back into earlier life-cycle phases, informing launch and mid-cycle pricing strategies.
Risk Management and Governance
LOE contract pricing is not merely a question of optimization; mis-steps can have systemic consequences:
- Excessive price competition can undermine supply viability and contribute to drug shortages, especially in generics.
- Deep discounts in one market can leak into international reference systems, compressing prices elsewhere.
- Over-reliance on a single supplier in contracts can create supply security risks for health systems and reputational risks for manufacturers if shortages occur.
Robust governance mechanisms should therefore encompass:
- Ethical and sustainability considerations in pricing decisions, particularly in markets with limited alternative suppliers.
- Structured risk assessments for large LOE contracts, including supply, reputational and policy risks.
- Scenario planning for adverse outcomes, such as unexpectedly aggressive competitor entry or new policy instruments (e.g. volume-based procurement mandates).
Conclusion
Loss of exclusivity is no longer a predictable, linear end-of-life erosion curve. In contract-driven markets, it is an inflection point where data, analytics and disciplined strategy can materially alter the trajectory of revenue and margin. Price declines of 30–80% post-LOE are common across high-income markets, yet the timing, depth and distribution of that erosion are heavily influenced by how originators and competitors behave in the first contract cycles.
By systematically analyzing contract awards, constructing robust LOE pricing corridors, and embedding intelligent guidance into front-line workflows, pharmaceutical and MedTech organizations can move from reactive discounting to proactive value management. Cross-functional LOE squads, supported by AI-enabled contract and pricing platforms, can ensure that each bid reflects not just local intuition but a global understanding of competitive dynamics, contract economics and long-term strategic objectives.
Sources:
The data in this report has been compiled from publicly available information, combined with Vamstar’s internal market insights and analysis, and the following sources:
- Merck / Keytruda sales and loss-of-exclusivity context:
- Gardasil 9 sales and US patent expiry timing:
- Eliquis and Opdivo revenue and patent-expiry horizon:
- Industry-wide patent cliff estimates for 2027–2028 and 2025–2030:
- Global orthopedic implants market size and outlook:
- Drug-eluting stent market size and forecast:
- https://www.grandviewresearch.com/horizon/outlook/drug-eluting-stent-market-size/global
- https://www.businesswire.com/news/home/20240501698204/en/Global-Drug-Eluting-Stents-Strategic-Research-Report-2024-Market-to-Reach-11.7-Billion-by-2030—JJ-Exit-from-DES-Market-Improves-Prospects-for-Competitors—ResearchAndMarkets.com
- Transcatheter aortic valve replacement / structural heart market outlook:
- EU public medical device contracts and annual contract value:
